
Table of Contents

How Do Unexplained Timeouts Impact .NET Integration Testing?
While working on a high-throughput logistics platform running on .NET 10, we encountered a situation where continuous integration tests were sporadically timing out. The architecture relied on an external route-calculation process communicating with our live test suite via a local HTTP proxy. Intermittent timeouts in functional integration tests are notoriously difficult to debug because they often point to subtle race conditions, hidden filesystem locks or thread-pool starvation rather than outright functional defects.
To diagnose the application, we initially enabled standard native .NET profiling. We launched the external process from the live test with standard environment variables to enable the EventPipe, wrote the output to a trace file and parsed it using standard diagnostic libraries. While this generated beautiful reports showing assembly load times, garbage collection pauses and stack sampling, we were still flying blind regarding the actual wall-clock duration of individual method executions. This gap in observability inspired this deep-dive article. Whether you are aiming to troubleshoot complex .NET environments or looking to hire software developer teams capable of handling robust CI/CD pipelines, understanding how to implement zero-code exact method tracing is critical.
What Causes Intermittent Test Failures in High-Concurrency .NET Systems?
In our business use case, the integration test suite was simulating hundreds of concurrent fleet routing requests. The test process itself performed extensive setup, configuring recorded HTTP proxy responses and interacting with the local filesystem before invoking the external .NET process under test.
The problem manifested as random test timeouts across different test runners. The challenge was twofold: first, the test process itself was not being profiled. We suspected that taking local filesystem locks and configuring proxy states on the test side might be blocking execution and consuming precious milliseconds. Second, the metrics we gathered from the external process only provided statistical stack sampling. We knew which methods were on the CPU most frequently, but we did not know how many times they were called, nor their exact entry and exit timestamps. Without this data, interleaving concurrent execution paths to find the exact bottleneck was impossible.
Why Is Stack Sampling Insufficient for Precise Method Invocation Tracing?
When analyzing the profiling data, we realized the core limitation of CPU stack sampling. Stack sampling periodically interrupts the application (e.g., every millisecond) and records the current call stack. This is highly efficient and provides an excellent macro-level view of CPU-bound bottlenecks.
However, what went wrong in our diagnostic approach was relying on sampling to track I/O-bound blocking and precise method durations. A method that runs thousands of times but only takes a microsecond might rarely appear in a stack sample. Conversely, a method waiting on a lock might appear frequently, but sampling won’t tell you the exact start and end time of that wait. We needed a timeline of every method invocation, interleaved between the concurrent test runner and the external process. We wanted to see exactly when the test requested a lock, when the external process started parsing the request and where the exact delay occurred, all without littering our codebase with manual stopwatch code or conditional compilation directives.
How Can We Intercept Method Execution in .NET Without Code Modification?
To trace exact method invocation start, end times and durations during live tests, we evaluated several techniques that avoid manual code changes. We considered these solutions carefully to balance overhead and accuracy.
Can We Use Compile-Time IL Weaving?
One approach we explored was using tools like Fody with custom weavers. IL weaving modifies the Intermediate Language (IL) assemblies at compile time, injecting timing logic at the beginning and end of every method. While effective and virtually free of runtime instrumentation overhead, this approach requires modifying the build pipeline. It also generates bloated assemblies and doesn’t easily extend to third-party dependencies without complex post-build steps.
Does the CLR Profiling API Offer Native Method Interception?
The CLR Profiling API (specifically the ICorProfilerCallback interface) allows tracking method entry and exit using native C++ extensions. This is the underlying technology used by commercial Application Performance Monitoring (APM) tools. It dynamically rewrites IL at runtime to inject telemetry. Building a custom C++ CLR profiler from scratch is incredibly complex and risky for a single project scope. Fortunately, we realized we could leverage existing open-source implementations of this API.
Can OpenTelemetry Auto-Instrumentation Solve This?
OpenTelemetry (OTel) provides a .NET Automatic Instrumentation library. Under the hood, it uses the exact CLR Profiling API mentioned above. By setting specific environment variables, the OTel profiler injects bytecode into running .NET processes to emit traces. While it normally targets web requests and database calls, it can be configured to trace custom methods. This provided a compelling, zero-code, open-source path forward.
Is EventPipe Configuration Enough for Full Tracing?
We revisited EventPipe, wondering if there was a hidden provider for method entry/exit. While .NET provides rich diagnostic events, emitting an event for literally every method execution via EventPipe natively without a CLR profiler would destroy performance and is not exposed out-of-the-box for arbitrary user code. A profiler-based approach was necessary.
How Do You Implement Zero-Code Method Tracing in .NET 10?
We finalized our architecture by leveraging OpenTelemetry .NET Automatic Instrumentation customized for localized testing. This allowed us to capture start, end and duration metrics for both the test process and the external system without altering their source code.
First, we downloaded the OpenTelemetry .NET automatic instrumentation binaries. We then updated our live test bootstrap script to launch both the test runner and the external process with the following profiling environment variables:
CORECLR_ENABLE_PROFILING=1
CORECLR_PROFILER={Placeholder-OTel-Profiler-Guid}
CORECLR_PROFILER_PATH=./profiler/OpenTelemetry.AutoInstrumentation.Native.dll
OTEL_DOTNET_AUTO_TRACES_ADDITIONAL_SOURCES=OurCompany.Logistics.*
OTEL_TRACES_EXPORTER=console
OTEL_EXPORTER_OTLP_ENDPOINT=http://localhost:4317
To capture specific method-level timing, we utilized the OTel configuration that allows targeting specific namespaces for instrumentation. Since instrumenting every single method in the entire CLR would cause the process to crash from overhead, we scoped the instrumentation strictly to our domain logic and the HTTP proxy configuration modules.
During the test run, both processes emitted standardized trace spans containing exact wall-clock start times and durations. We configured a local lightweight collector to ingest these traces and write them to a structured file. After the test timeout occurred, we opened the interleaved trace data. The visualization immediately highlighted the root cause: a filesystem lock mechanism within the proxy setup of the live test itself was blocking the test thread for nearly 8 seconds under high concurrency, causing the external process to starve while waiting for inputs.
By shifting to dynamic bytecode instrumentation, we completely bypassed the limitations of stack sampling and found the exact bottleneck without touching a single line of application code.
What Are the Best Practices for Profiling Live Integration Tests?
Through resolving this bottleneck, our team extracted several actionable insights that engineering teams can apply when testing highly concurrent systems. Organizations looking to hire dotnet developers for enterprise modernization should ensure their teams are familiar with these advanced diagnostic strategies.
- Profile the test alongside the target: A live test is an application in its own right. Never assume the bottleneck resides solely in the external system under test.
- Understand sampling versus tracing: CPU sampling is excellent for optimizing hot paths. Execution tracing is necessary for debugging concurrency, deadlocks and I/O wait times.
- Scope dynamic instrumentation tightly: Injecting method boundaries at runtime incurs significant overhead. Always scope your CLR profiler target to specific namespaces to prevent test execution from slowing down artificially.
- Interleave external and internal logs using a unified clock: By pushing telemetry from both processes to a unified collector (like an OpenTelemetry endpoint), you ensure timestamps are perfectly aligned for chronological analysis.
- Avoid manual stopwatch code: Relying on manual timer injection introduces code smell and risks being deployed to production. Rely on runtime IL rewriting or native CLR profilers for debugging.
- Modernize observability pipelines: Standardize on OpenTelemetry even for local test runs. The skills required to build this translate directly to production environments. This is a key capability we look for when we hire backend developers for scalable systems.
How Does Deep Profiling Improve Software Quality?
By replacing statistical stack sampling with dynamic, precise method execution tracing, we successfully isolated and resolved the hidden locking issue within our test infrastructure. The combination of CLR Profiling APIs and OpenTelemetry allowed us to achieve exact method invocation tracking across separate .NET 10 processes without modifying our source code. Mastering these profiling tools distinguishes mature engineering teams from the rest, ensuring that complex platforms scale predictably. If you are struggling with complex architectural bottlenecks or looking to expand your remote team with vetted experts, contact us.
Social Hashtags
#DotNET #DotNET10 #OpenTelemetry #SoftwareTesting #IntegrationTesting #PerformanceTesting #ApplicationPerformance #DevOps #CICD #Observability #BackendDevelopment #SoftwareDevelopment
Frequently Asked Questions
Yes, but it is highly complex. While the native CLR Profiling API can inspect the stack and read method arguments, automated tools like standard OpenTelemetry auto-instrumentation typically avoid this by default due to security, performance overhead and the risk of memory leaks. You would need a custom profiler for argument interception.
Absolutely. The OpenTelemetry .NET native profiler is cross-platform. You simply need to ensure you provide the correct .so (Linux) or .dll (Windows) path in the CORECLR_PROFILER_PATH environment variable.
EventPipe is highly optimized, but the CLR does not natively emit an event for every method entry/exit because the volume of data would be catastrophic for performance. EventPipe is best suited for framework-level events (GC, JIT, HTTP requests) rather than arbitrary user-code method boundaries.
Yes. Injecting timing logic into every method disables certain JIT optimizations, increases memory usage and adds direct execution overhead. This is why targeting specific namespaces or classes is critical when using dynamic instrumentation in functional testing environments.
Success Stories That Inspire
See how our team takes complex business challenges and turns them into powerful, scalable digital solutions. From custom software and web applications to automation, integrations, and cloud-ready systems, each project reflects our commitment to innovation, performance, and long-term value.
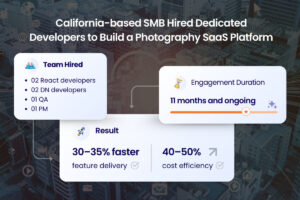
California-based SMB Hired Dedicated Developers to Build a Photography SaaS Platform
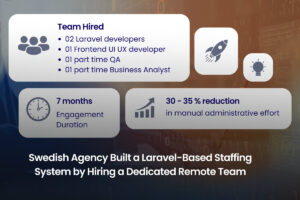
Swedish Agency Built a Laravel-Based Staffing System by Hiring a Dedicated Remote Team