Table of Contents

INTRODUCTION
While working on a patient management and insurance processing platform for a client in the healthcare industry, our engineering team encountered a critical stability issue just weeks before a major open enrollment period. The system, designed to handle thousands of concurrent claim submissions, began exhibiting erratic behavior during load testing.
We realized that as the dataset grew, specific reporting endpoints—critical for administrators to monitor daily claim throughput—were timing out. The application server logs were clean, but the database metrics told a different story. This wasn’t just a slow query; it was a systemic architectural bottleneck that threatened to freeze the entire platform during peak usage. This challenge inspired this article, detailing how we moved from crisis to stability by refining our data access strategy.
PROBLEM CONTEXT
The platform was built on a modern .NET Core microservices architecture, utilizing SQL Server for persistence and Entity Framework (EF) Core as the ORM. The specific module in question was the “Claims Dashboard,” a real-time interface used by insurance providers to view active, pending, and rejected claims.
Business requirements dictated that this dashboard load within 500 milliseconds. However, as the production database size swelled to millions of records, the complexity of the data relationships (Patients -> Policies -> Claims -> Providers) began to strain the system. The issue surfaced specifically when the system attempted to aggregate claim statuses alongside patient demographic data. What worked perfectly in the development environment with seed data was failing catastrophically under near-production data volume.
WHAT WENT WRONG
Upon investigating the monitoring dashboards, we observed the SQL Server CPU pinning at 100% usage during the spikes. We isolated the logs and identified several alarming patterns.
First, we found a classic “N+1” query problem. For every list of claims retrieved, the application was executing separate database calls to fetch the associated patient details and policy information. If a page displayed 50 claims, the system executed 51 separate queries.
Second, we noticed a memory bloat in the application container. The root cause was inefficient change tracking. The dashboard was a read-only view, yet the application was retrieving full entity objects with change tracking enabled. This meant the framework was incurring the overhead of snapshotting every object for potential updates that would never happen.
Finally, the generated SQL revealed that the application was selecting every column in the table (`SELECT *`), including heavy binary data stored in the patient records, despite the UI only requiring the patient’s name and ID. This unnecessary data transfer was clogging the network bandwidth and saturating the database I/O.
HOW WE APPROACHED THE SOLUTION
Diagnosing performance issues in distributed systems requires a methodical approach to avoid premature optimization. Our team followed a three-step diagnostic process:
- Profiling the Data Layer: We utilized SQL Profiler and Application Performance Monitoring (APM) tools to capture the exact SQL statements being generated by the application during the timeout events.
- Analyzing Execution Plans: We examined the query execution plans to identify missing indexes and table scans. We confirmed that the heavy binary columns were forcing the database to perform expensive I/O operations.
- Code Review of LINQ Queries: We traced the SQL back to the specific repository methods in the .NET codebase. We analyzed the LINQ expressions to understand why the ORM was generating suboptimal SQL.
We considered implementing a caching layer (Redis) immediately, but decided against it as a primary fix. Caching a slow query is a temporary band-aid; we needed to solve the underlying architectural inefficiency first. Caching was reserved as a secondary optimization layer once the database interaction was healthy.
FINAL IMPLEMENTATION
The solution involved refactoring the data access layer to prioritize “Projection” over “Entity Retrieval” and disabling unnecessary overhead. When companies hire dotnet developers for enterprise modernization, this ability to dissect and optimize ORM behavior is often the differentiating factor between a sluggish app and a performant one.
1. Implementing Projections (Select vs. Include)
We replaced the heavy retrieval of full entities with lightweight Data Transfer Objects (DTOs). By using the `.Select()` method in LINQ, we instructed EF Core to generate SQL that fetched only the required columns.
// BEFORE: Inefficient retrieval of full entities with N+1 issue
var claims = context.Claims
    .Include(c => c.Patient)
    .Include(c => c.Policy)
    .Where(c => c.Status == "Active")
    .ToList();
// AFTER: Optimized Projection to DTO
var claimsDto = context.Claims
    .Where(c => c.Status == "Active")
    .Select(c => new ClaimSummaryDto
    {
        ClaimId = c.Id,
        Amount = c.TotalAmount,
        PatientName = c.Patient.FirstName + " " + c.Patient.LastName,
        PolicyNumber = c.Policy.Number
    })
    .ToList();
2. Disabling Change Tracking
Since the dashboard is a read-only interface, we disabled change tracking. This simple change significantly reduced the memory footprint and CPU processing time on the web server.
// Using AsNoTracking for read-only scenarios
var activeClaims = context.Claims
    .AsNoTracking()
    .Where(c => c.DateSubmitted > DateTime.UtcNow.AddDays(-30))
    .ToList();
3. Database Indexing Strategy
We added composite indexes covering the columns used in the `WHERE` clauses (Status, DateSubmitted) and included the columns frequently retrieved in the `SELECT` clause. This allowed the SQL engine to satisfy the query entirely from the index (Index Seek) without touching the heavy table heap.
Following these changes, we re-ran the load tests. The API response time dropped from an average of 3.2 seconds to 180 milliseconds, and database CPU usage stabilized at 15% under the same load.
LESSONS FOR ENGINEERING TEAMS
Optimizing for scale requires looking beyond code logic and understanding how your application interacts with the underlying infrastructure. Here are the key takeaways:
- Monitor Generated SQL: Never assume your ORM is making the best decisions. Regularly inspect the actual SQL queries being executed in production.
- Read-Only Optimization: Always use `AsNoTracking()` (or equivalent in other stacks) for read-only data access to save memory and processing cycles.
- Project, Don’t Fetch: Avoid fetching full entities unless you plan to modify them. Use projections to retrieve only the data the client needs.
- Validate with Load Testing: Performance issues often lie dormant until concurrent user counts rise. Incorporate load testing into your CI/CD pipeline.
- Hire Specifically: When you need to scale, hire software developer talent that understands database internals, not just syntax.
WRAP UP
By addressing the root causes of data access inefficiency—specifically N+1 queries and unnecessary data fetching—we successfully stabilized the client’s healthcare platform ahead of their critical enrollment period. Engineering maturity isn’t just about building features; it’s about ensuring those features perform reliably under pressure.
Social Hashtags
#DotNetCore #EFCore #APIPerformance #SoftwareArchitecture #BackendDevelopment #HealthTech #Microservices #DatabaseOptimization #EntityFramework #TechCaseStudy #ScalableSystems #EnterpriseSoftware
If you are facing performance bottlenecks in your critical applications, contact us to discuss how our dedicated engineering teams can help.
Frequently Asked Questions
The N+1 problem occurs when an application executes one query to fetch a list of records (N) and then executes a separate query for each record to fetch related data (+1). This results in massive database overhead. It is typically solved using "Eager Loading" or "Projections."
Entity Framework is excellent for complex business logic, CRUD operations, and maintaining code consistency. Dapper is a micro-ORM that is faster and better suited for high-performance, read-heavy scenarios or complex raw SQL execution. Many successful projects use a hybrid approach.
In .NET EF Core, `AsNoTracking` tells the context not to take a snapshot of the retrieved entities. This skips the overhead of setting up change detection, which reduces memory usage and improves query execution speed for read-only data.
Selecting all columns increases the amount of data transferred over the network and forces the database to read more pages from disk. If a table contains large text or binary fields that aren't needed for the specific request, the performance penalty can be severe.


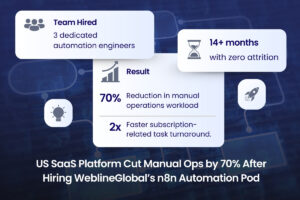
Success Stories That Inspire
See how our team takes complex business challenges and turns them into powerful, scalable digital solutions. From custom software and web applications to automation, integrations, and cloud-ready systems, each project reflects our commitment to innovation, performance, and long-term value.
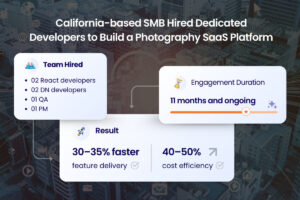
California-based SMB Hired Dedicated Developers to Build a Photography SaaS Platform
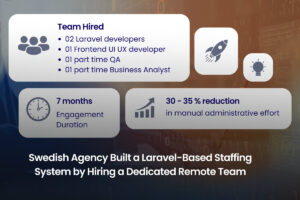
Swedish Agency Built a Laravel-Based Staffing System by Hiring a Dedicated Remote Team