Table of Contents

INTRODUCTION
While working on a logistics data aggregation platform for a global retail client, we encountered a significant observability challenge within our automation pipelines. The system was designed to pull inventory updates from five different warehouse management systems (WMS) and normalize them into a central ERP.
To keep the workflow efficient, we routed all five streams into a single n8n Filter node to apply universal validation logic (e.g., ignoring items with zero stock). However, during user acceptance testing, we realized we had a “black box” problem. When the ERP received fewer items than expected, we couldn’t easily determine which of the five warehouses was dropping data without manually clicking through n8n’s execution logs and toggling through “Input 0,” “Input 1,” etc.
Production environments require better visibility than manual dropdown inspection. We needed an automated summary that explicitly stated: “Warehouse A: 50 kept, Warehouse B: 0 kept.” This challenge led us to implement an “Upstream Tagging” pattern that ensures data lineage is preserved through merge and filter operations, a technique we now recommend whenever companies hire software developers for complex workflow automation.
PROBLEM CONTEXT
The architecture involved a “fan-in” pattern. Multiple independent HTTP Request nodes fetched data from distinct sources. To avoid duplicating logic, we connected all these sources to a single Filter node.
In n8n, when multiple nodes connect to the same input of a downstream node, the data is often processed in sequence or batches. In the execution UI, n8n cleanly separates these inputs in a dropdown menu. However, programmatically, the output of the Filter node is simply a stream of JSON objects. The metadata regarding “which connection this came from” is not inherently attached to the JSON item itself in a way that downstream nodes can easily aggregate.
The business requirement was to generate a Slack notification summarizing the sync job:
Sync Complete:
Source A: 45 items processed
Source B: 120 items processed
Source C: 337 items processed
Total: 502 items
Without this granularity, the operations team could not detect if a specific source failed silently (returning 0 items) masked by the success of other sources.
WHAT WENT WRONG
Initially, we attempted to use standard n8n expression references to count items. However, we hit several bottlenecks:
- Loss of Context: Once items passed the Filter node, they were just an array of objects. If two warehouses sold the same SKU, the items looked identical.
- Manual Debugging Overhead: To verify counts, engineers had to open the execution ID, find the Filter node, and manually check 5+ input contexts. This added hours to debugging cycles.
- Fragile Indexing: We considered using the run index (
$runIndex), but this is unreliable in complex asynchronous flows where execution order isn’t guaranteed.
We realized that relying on n8n’s internal execution UI for data lineage was an architectural oversight. We needed the data itself to carry its own origin story.
HOW WE APPROACHED THE SOLUTION
To solve this, we applied a standard data engineering principle: Enrichment at Source. Instead of trying to deduce the source after the filter, we decided to explicitly tag the data before it entered the shared logic.
The solution involved three steps:
- Upstream Tagging: Inject a
source_idproperty immediately after fetching data from each branch. - Filtering: Allow the tagged data to pass through the common Filter node.
- Downstream Aggregation: Use a Code node after the filter to group by
source_idand generate the summary.
This approach transforms the problem from a “platform metadata” issue to a “data transformation” task, which is far more robust. It is a standard pattern we look for when we hire n8n developers for workflow automation projects.
FINAL IMPLEMENTATION
Here is the technical implementation of the Upstream Tagging and Aggregation pattern.
Step 1: Inject Source Metadata
After each source node (e.g., the HTTP Request for Warehouse A), add a Set node (or Code node) to append a source identifier.
Set Node Configuration (Branch A):
- Name:
Set Source A - Fields to Set:
- Name:
_sourceName - Value:
Warehouse_A
- Name:
Repeat this for Branch B, C, etc., changing the value accordingly.
Step 2: The Filter
Connect all “Set Source” nodes to your central Filter node. The Filter node operates as usual (e.g., {{ $json.quantity > 0 }}). Since the _sourceName is part of the JSON object, it survives the filtering process.
Step 3: Aggregate and Count
Immediately after the Filter node, use a Code Node to generate the summary. This node iterates over all incoming items, groups them by the _sourceName property, and calculates the counts.
// Code Node: Summarize Counts
const items = $input.all();
const summary = {};
let total = 0;
// Iterate over filtered items to aggregate counts
items.forEach(item => {
  const source = item.json._sourceName || 'Unknown_Source';
  if (!summary[source]) {
    summary[source] = 0;
  }
  summary[source]++;
  total++;
});
// Format the output string
let reportText = "Sync Summary:n";
for (const [key, count] of Object.entries(summary)) {
  reportText += `${key}: ${count} items keptn`;
}
reportText += `Total: ${total} items`;
// Return the summary for the next node (e.g., Slack/Email)
return [{
  json: {
    report: reportText,
    stats: summary,
    total_count: total
  }
}];
This script produces a clean JSON object containing the pre-formatted text block and the raw stats, perfect for sending to Slack, Teams, or an email monitoring service.
LESSONS FOR ENGINEERING TEAMS
Implementing this pattern highlighted several key takeaways for building scalable automation:
- Data Lineage is Explicit: Never assume the platform will track where data came from. If the origin matters, write it into the data schema as early as possible.
- Avoid UI-Dependent Debugging: If you have to click a UI element to see a metric, that metric is useless for automated monitoring. Build self-reporting workflows.
- Standardize Metadata: Enforce a naming convention (like
_sourceNameor_meta_origin) across all workflows to make aggregation logic reusable. - Decouple Logic from Sources: By tagging data, you can add 10 more sources later without changing the Filter or Aggregation logic, making the system highly extensible.
WRAP UP
Counting items per input connection in n8n requires shifting from relying on execution metadata to implementing explicit data tagging. by injecting source identifiers upstream and aggregating them downstream, we transformed a manual debugging process into a transparent, automated reporting system. This level of observability is essential for enterprise-grade automation.
Social Hashtags
#n8n #WorkflowAutomation #DataLineage #ETL #DataEngineering #AutomationEngineering #NoCode #LowCode #DevOps #Observability #SystemDesign #EnterpriseAutomation
If you are looking to scale your automation infrastructure or need to contact us regarding dedicated engineering teams, we can help structure your digital transformation initiatives.
Frequently Asked Questions
Technically yes, you can query the internal execution database, but it is complex, resource-intensive, and prone to breaking changes. Injecting metadata directly into the JSON items is significantly more stable and performant.
Yes. If you use a Merge node (in "Append" mode) before the Filter, the _sourceName property will still be preserved. The Code node aggregation logic remains exactly the same.
The approach above counts items that passed the filter. To count dropped items, you would need to perform the aggregation before the filter as well, and then compare the pre-filter and post-filter counts in a final summary node.
If your sources are dynamic (e.g., looping through a list of API endpoints), you can dynamically set the _sourceName using the loop index or the API URL parameter inside the loop, ensuring every item is still traceable.


Success Stories That Inspire
See how our team takes complex business challenges and turns them into powerful, scalable digital solutions. From custom software and web applications to automation, integrations, and cloud-ready systems, each project reflects our commitment to innovation, performance, and long-term value.
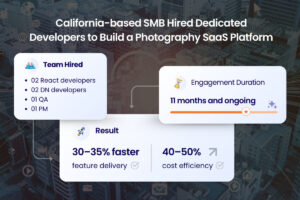
California-based SMB Hired Dedicated Developers to Build a Photography SaaS Platform

Swedish Agency Built a Laravel-Based Staffing System by Hiring a Dedicated Remote Team